The Power Gauge Report is a game-changing suite of investment tools that could take your portfolio to another level. We’re giving this Chaikin Analitycs service a full inspection in our Marc Chaikin Power Gauge Report Review, so keep reading to find out if it can really help you master the market.
In the new marketing campaign Marc Chaikin, an investment legend from Chaikin Analytics is presenting The Power Gauge Report, a system that he and his team have developed recently. He calls it “the culmination of his life’s work”.
Table of Contents
- 1 Who is Marc Chaikin?
- 2 Chaikin’s Prediction for 2022
- 3 The Power Gauge Report Review: Overview
- 4 The Power Gauge Report – How It Works?
- 5 How much money can you make with The Power Gauge Report?
- 6 How to get started with The Power Gauge Report?
- 7 What’s included in The Power Gauge Report Subscription?
- 8 The Power Gauge Report Subscription Fee
- 9 The Power Gauge Report Refund Policy
- 10 What is Chaikin Analytics?
Who is Marc Chaikin?
Marc Chaikin spent 50 years on Wall Street helping banks to make money.
He is the creator of one of most popular indicators that is used by many banks, hedge funds, and every major brokerage site.
He survived 9 bear markets and helped create three new indices for the Nasdaq. After long successful career he retired in 2000.
Marc came back to launch Chaikin Analytics after his wife lost around 50% of her 401(K) in 2008 because of her bad money manager. At that time he thought “Gee, I’ve spent my whole life helping Wall Street get richer… when ordinary folks like my wife Sandy are getting fleeced.”
Chaikin’s Prediction for 2022
Marc found an investment he believes is the biggest prediction of his 50-year career on Wall Street. Bull or bear market.
In this video he makes two recommendations (one BULLISH, one BEARISH) both related to the long-term impact of COVID-19 lockdown.
His #1 bullish recommendation is Mimecast Limited. Mimecast Limited was established in 2003. It is UK-headquartered company specializing in cloud-based email management for Microsoft Exchange and Microsoft Office 365. It is NASDAQ listed since Nov 19th, 2015. Symbol MIME.
Marc’s number one bearish pick is Zillow. Many of you already know Zillow. It is an American online real estate marketplace company that was founded in 2006. Symbol ZG. The Power Gauge rating on Zillow is now bearish.
Marc Chaikin prediction is that there will be a historic Digital shift in how America is doing business after COVID-19. It will extend everything society adapted to during lockdown in many new directions.
Chaikin’s advice is people to invest in cybersecurity, high-speed Internet, new social media platforms, artificial intelligence, and more. That’s exactly what the Power Gauge is doing right now.
— RECOMMENDED —
A New Way To See Which Stocks Could Double Your Money
We want to give you FREE access to the Power Gauge system ($5,000 value).
Claim FREE access to The Power Gauge Here
The Power Gauge Report Review: Overview
Let’s take a closer look into Power Gauge.
Marc and his team developed a way to analyze 4,000 different stocks to predict which ones could take off by 100% to 500% or more.
The thing is – Marc has a huge, you might say unfair advantage, after half a century on Wall Street. Remember, he built the indicator that banks use to determine the stock ratings. He come back from his retirement to rebuild this indicator as a system for everyday people that shows tomorrow’s stock ratings on Wall Street… TODAY.
The Power Gauge Report – How It Works?
Here how it works. Power Gauge Report System uses 20 factors. The same factors large investors use to make their decisions. It has its own “secretive way” to compute this information and predict with remarkable accuracy a stock’s rating over the next 3 to 6 months and beyond. The rating is either “Bullish”, “Neutral” or “Bearish”.
Now let’s talk a little about this “secretive way” of computation. The factors used are divided in four categories:
First are Financials:
- Debt to Equity ratio
- Price to Book Value Ratio
- Return On Equity
- Price to Sales Ratio
- Free Cash Flow Analysis
Second, they look at Earnings
- Earnings growth
- Earnings Surprise
- Earnings trend
- Projected Price/Earnings ratio
- Earnings Consistency
Third, they look at technical info that includes:
- Strength of individual stock vs. S&P 500
- Chaikin Money Flow
- Chaikin Trend
- Price Trend Rate of Change
- Volume Trend
These factors measure price and volume activity – including that bullish/bearish indicator he developed back in 1980s and now it bears Chaikin’s name on the Bloomberg terminal.
Last category is called Experts. What corporate insiders and institutional investors are doing and saying at any given moment:
- Earnings Estimate Revision
- Short Interest
- Insider Activity
- Analyst Opinions
- Strenght of Industry Group vs. the Market
All these factors for more than 4,000 stocks are included in algorithm. Power Gauge system creates a cheat sheet predicting the future rating.
Probably by now you are asking yourself the same question – How can a computer algorithm consider what’s happening in the real world each day and update the stock rating?
Power Gauge Report is designed to anticipate the short-term future considering what insiders and experts are saying and doing.
The system updates overnight and evaluates real-time news.
During this presentation Marc Chaikin gives multiple examples of how Power Gauge alerted subscribers about opportunities to invest even when he was not confident in this investment idea.
One of the best parts is that Power Gauge doesn’t look only at consumer interest. It also evaluates company’s fundamentals. All these factors go into their weighting system.
How much money can you make with The Power Gauge Report?
For example, The Pandemic. Back in 2020 the rumors of the virus were in the news, but the bull market was going strong.
Suddenly on February 2nd, The Power Gauge “swung away from being Bullish for the first time in months and a number of stocks lit up BEARISH. Including Marriott, Chevron, Tiffany, and many more.”
In the beginning It didn’t make sense to Marc. Soon Marriott went on to fall 54%, Chevron fell 52%, and Tiffany fell 23%. This is not the first time. Looks like the Power Gauge has a long history of finding turning points in the rise and the fall in the market.
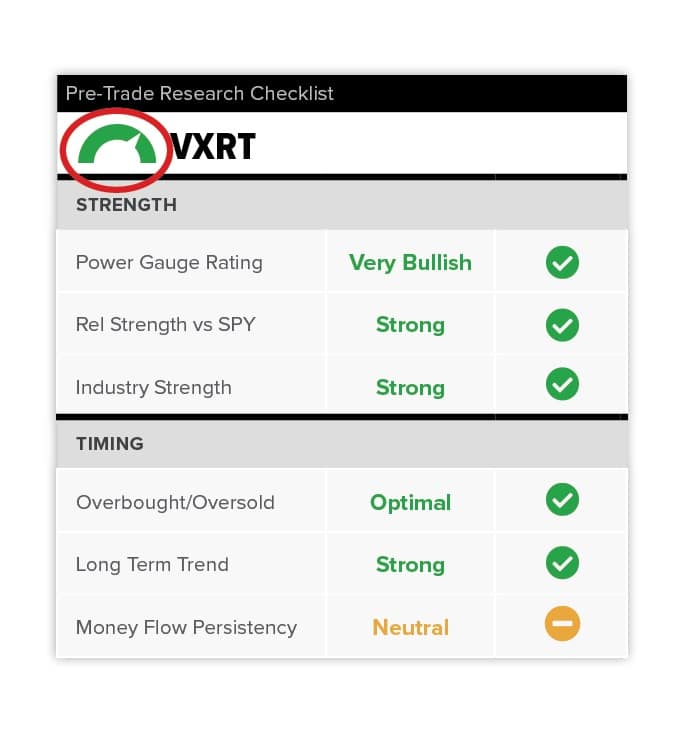
Power Gauge is designed to be used by everyday people. The only thing that users should pay attention is the stock rating up here.
Source: chaikinanalytics.com
They even added graduations like “Very Bullish” or “Neutral-Negative,”
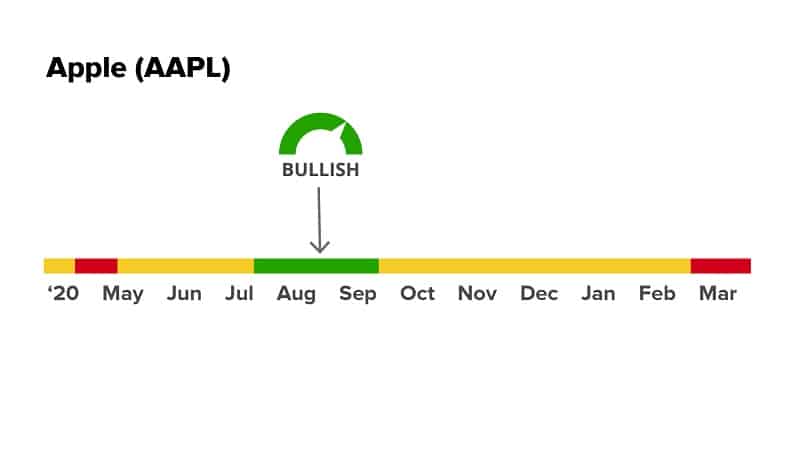
for better understanding where the stocks might be going. They use the red/yellow/green system to make buying and selling as easy as possible.
When a stock is rated Bullish, it lights up GREEN.
Source: chaikinanalytics.com
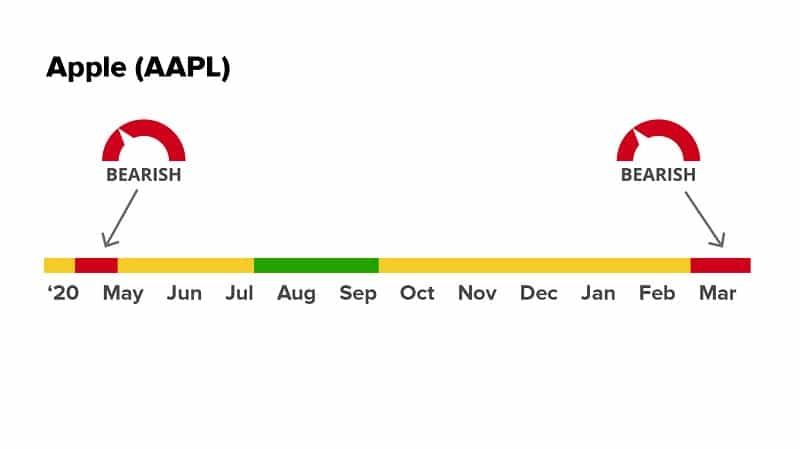
When it’s Bearish, it lights up RED.
Source: chaikinanalytics.com
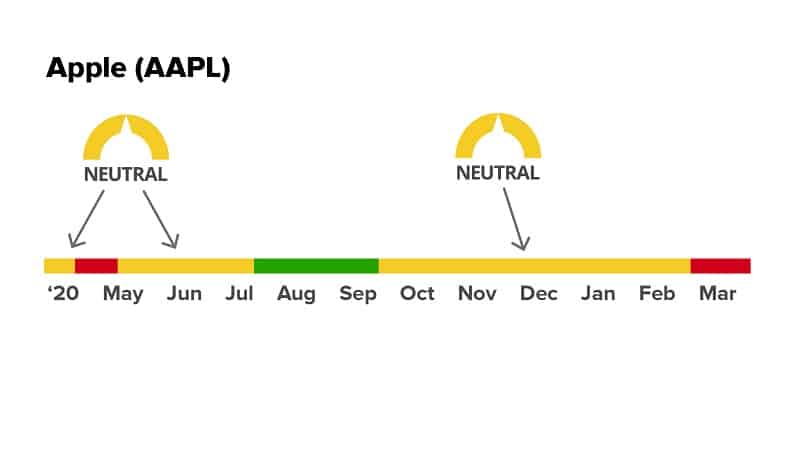
When it’s Neutral, it lights up YELLOW.
Source: chaikinanalytics.com
His wife had no experience in finance. She bought stocks using this system and made more than 7 times her money.
How to get started with The Power Gauge Report?
Good starting point is Marc’s full research report about the 20 factors used in Power gauge system and how to calculate them.
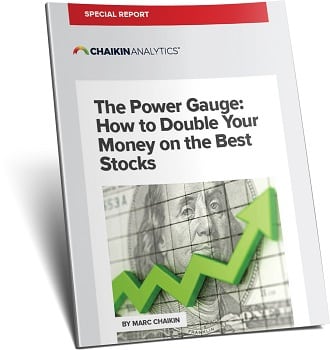
It’s called The Power Gauge: How to Double Your Money on the Best Stocks.
It gives you an overview of how this system works. Inside you will find the following information:
- The one thing that shows you where a stock is going next.
- How to time the perfect point to buy or sell any stock.
- What the Smart Money on Wall Street always looks for in choosing a stock they can comfortably invest millions of dollars into… and more.
The Power Gauge: How to Double Your Money on the Best Stocks – Download Here
What’s included in The Power Gauge Report Subscription?
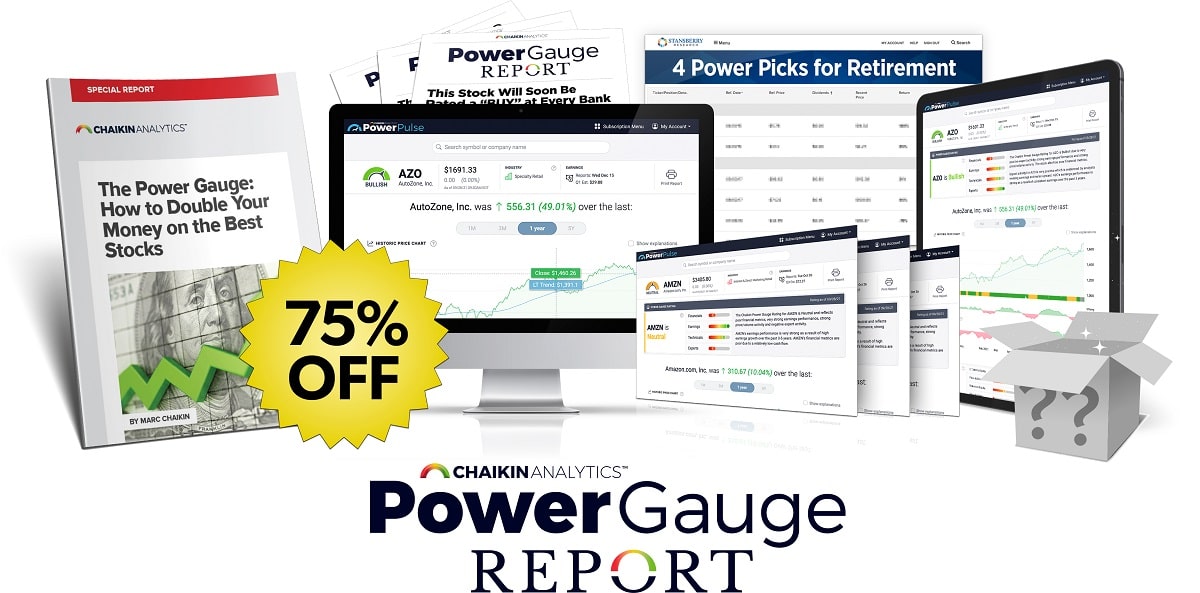
Each month Marc Chaikin and his team analyze current market and will uncover 40 stocks. They pick #1 stock to recommend in Power Gauge Report, along with portfolio of other stocks they believe could double or triple their subscriber’s investment. When the system says to sell, they’ll alert their subscribers on when to close their position for the biggest potential gain.
Subscribers will receive also:
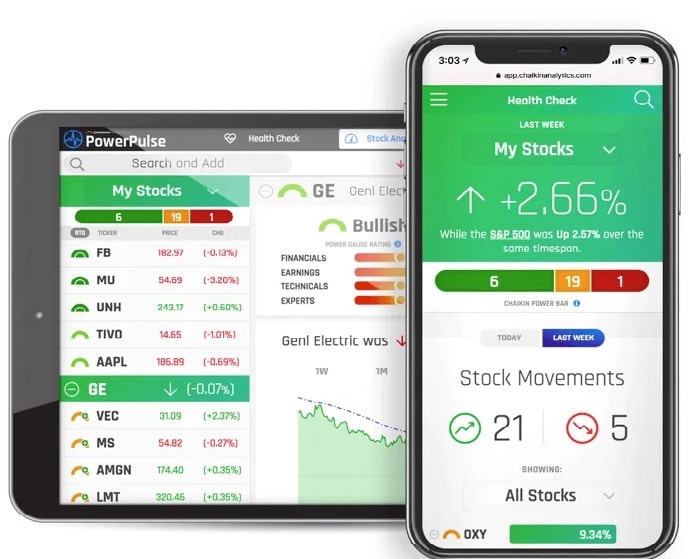
- FREE 1-year access to the Power Pulse system, where you can type in any of 4,000 tickers to see which stocks could soon double
- model portfolio of the top 5 stocks to buy right now
- Throughout the month, Marc will email you updates as needed, telling you when to lock-in gains… add to or close a position… and any developments.
- 4 Power Picks for Retirement – the top 4 stocks to buy now and comfortably hold for the long run, with the potential to make multiple times my money along the way
- special report and a mystery gift (value $1,000)
- Marc Chaikin’s report, The Power Gauge: How to Double Your Money on the Best Stocks.
The Power Gauge Report Subscription Fee
You can try Marc Chaikin’s work Risk Free for only $49 per year.
Get Marc Chaikin’s The Power Gauge Report Here – Best Offer + Bonuses
The Power Gauge Report Refund Policy
You’ll have the next 30 days to review Marc’s special report and model portfolio, which shows you which stocks could double your money by predicting tomorrow’s stock ratings on Wall Street.
If you are not happy, call their Maryland-based Customer Service team and you will receive full refund from Chaikin Analytics.
What is Chaikin Analytics?
Chaikin Analytics is a stock trading idea platform founded by Marc Chaikin in 2011. According to Wikipedia the centerpiece of Chaikin Analytics is the Chaikin Power Gauge stock rating. In 2016 it was named one of “Two Top Websites for Quantitative Analysis” by Barron’s.
In their website you will find information about four services they provide:
- Chaikin Analitycs Annual Membership service that gives access to their research and analyses platform with over 5,000 stocks and ETFs. Currently the price is $2,195 (plus Tax) per year.
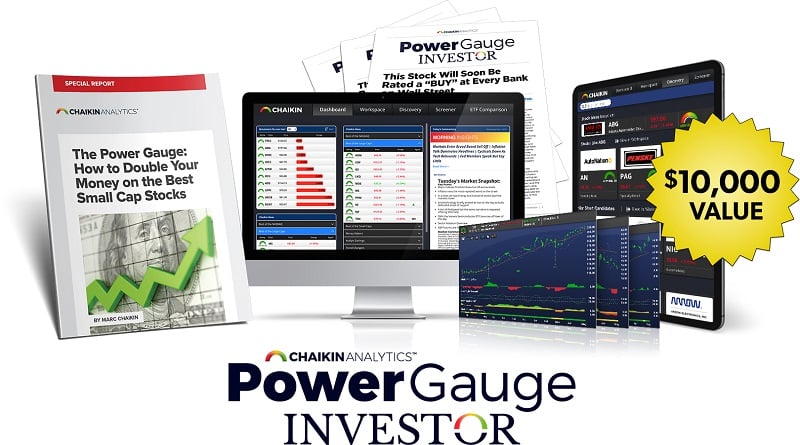
- Power Gauge Investor – The Power Gauge Investor is a brand new research service edited by Marc Chaikin. It’s a more comprehensive version of The Power Gauge Report.Each month, Marc Chaikin will email you a new briefing with his #1 small-cap stock recommendation with the potential to make you 3 to 5 times your money, according to the Power Gauge, along with a constantly updated model portfolio of the top 10 stocks to buy and the #1 stock to avoid.
- Power Gauge Report is the system we reviewed above. Retail price is $199 per year. You can subscribe for $49 if you use this link.
- PowerFeed Newsletter is Free daily email with insights and ideas. It is generated from their proprietary rating system.
